Plot Earthquake Seismicity Using PyGMT#
This code shows to plot the earthquake seismicity using PyGMT through Python programming Language. In this code, the PyGMT version is 0.9.0 and Python is 3.8.10. Please make sure that you use relevent PyGMT version with your Python version. For installing the PyGMT, please visit this page
[1]:
import pygmt
import pandas as pd
[2]:
fault_file = "D:\SHP\global_active_faults_gem\gem_active_faults_harmonized.gmt"
bathy = "D:\GRD\GEBCO_13_Jun_2026_602e88483e50\gebco_2026_sub_ice_n28.0_s-15.0_w90.0_e141.0_geotiff.tif"
[3]:
df_eq = pd.read_excel("EQ_USGS_CATALOG_ID_20250610_to_20260610.xlsx")

df_eq.describe()
[3]:
| time | latitude | longitude | depth | magnitude | tsunami | felt | cdi | mmi | |
|---|---|---|---|---|---|---|---|---|---|
| count | 2576 | 2576.000000 | 2576.000000 | 2576.000000 | 2576.000000 | 2576.000000 | 226.000000 | 226.000000 | 104.000000 |
| mean | 2025-12-18 07:03:56.811582464 | 0.588296 | 123.571329 | 58.338448 | 4.546739 | 0.003106 | 11.778761 | 3.070796 | 4.927587 |
| min | 2025-06-10 10:43:10.264000 | -11.758300 | 94.000400 | 3.291000 | 4.000000 | 0.000000 | 0.000000 | 0.000000 | 0.000000 |
| 25% | 2025-10-01 14:18:15.472750080 | -4.573025 | 123.752275 | 10.000000 | 4.300000 | 0.000000 | 1.000000 | 2.000000 | 4.132750 |
| 50% | 2025-12-28 08:01:10.017999872 | 1.166350 | 126.323250 | 35.000000 | 4.500000 | 0.000000 | 2.000000 | 2.700000 | 4.522000 |
| 75% | 2026-03-30 06:00:52.467000064 | 5.549275 | 127.639125 | 81.922750 | 4.700000 | 0.000000 | 4.750000 | 3.800000 | 5.463250 |
| max | 2026-06-09 23:14:43.247000 | 11.991700 | 139.828200 | 298.530000 | 7.800000 | 1.000000 | 647.000000 | 9.100000 | 8.944000 |
| std | NaN | 5.839700 | 9.609279 | 56.469068 | 0.391022 | 0.055652 | 51.984397 | 1.788565 | 1.340017 |
[ ]:
min_depth, max_depth = 0, 300
min_magnitude, max_magnitude = 4, 8
min_longitude_map, max_longitude_map, min_latitude_map, max_latitude_map = 90, 140, -15, 15
region_map = [min_longitude_map, max_longitude_map, min_latitude_map, max_latitude_map]
fig = pygmt.Figure()
pygmt.config(MAP_FRAME_TYPE = 'plain',
FONT='Times-Roman',
FONT_ANNOT_PRIMARY="30p",
FORMAT_GEO_MAP="ddd.xx",
FONT_TITLE="60p",
FONT_SUBTITLE="50p",
FONT_LABEL="20p")
# Plot coastline
# fig.coast(shorelines="1/0.5", water='lightblue', land='lightgrey', region=region_map, projection="M40/60")
# Plot with bathymetry (ignore the coastline if this is applied)
fig.grdimage(grid=bathy, cmap="SCM/oleron", region=region_map, projection="M40/60")
fig.colorbar(frame="xa2000f+lElevation (m)", position="n0.5/-0.08+w30/1+h")
# Plot earthquakes
pygmt.makecpt(cmap="seis", series=[df_eq.depth.min(), df_eq.depth.max()])
fig.plot(x=df_eq['longitude'], y=df_eq['latitude'], size=0.1 * (df_eq.magnitude), style="c", fill=df_eq.depth, pen="0.5p,black", cmap=True)
dm = (max_depth-min_depth)/10
dm2 = dm/2
fig.colorbar(frame=f"xa{dm}f{dm2}+lDepth (km)", position="n0/-0.08+w25/1+h")
# Fault
fig.plot(data=fault_file, pen="2p,black")
# Text Information
fig.text(text=["Earthquake Catalog: USGS","Fault: Global Active Faults"],
x=[min_longitude_map+0.5, min_longitude_map+0.5],
y=[min_latitude_map+2.5, min_latitude_map+3.5],
fill="white",
justify="ML"
)
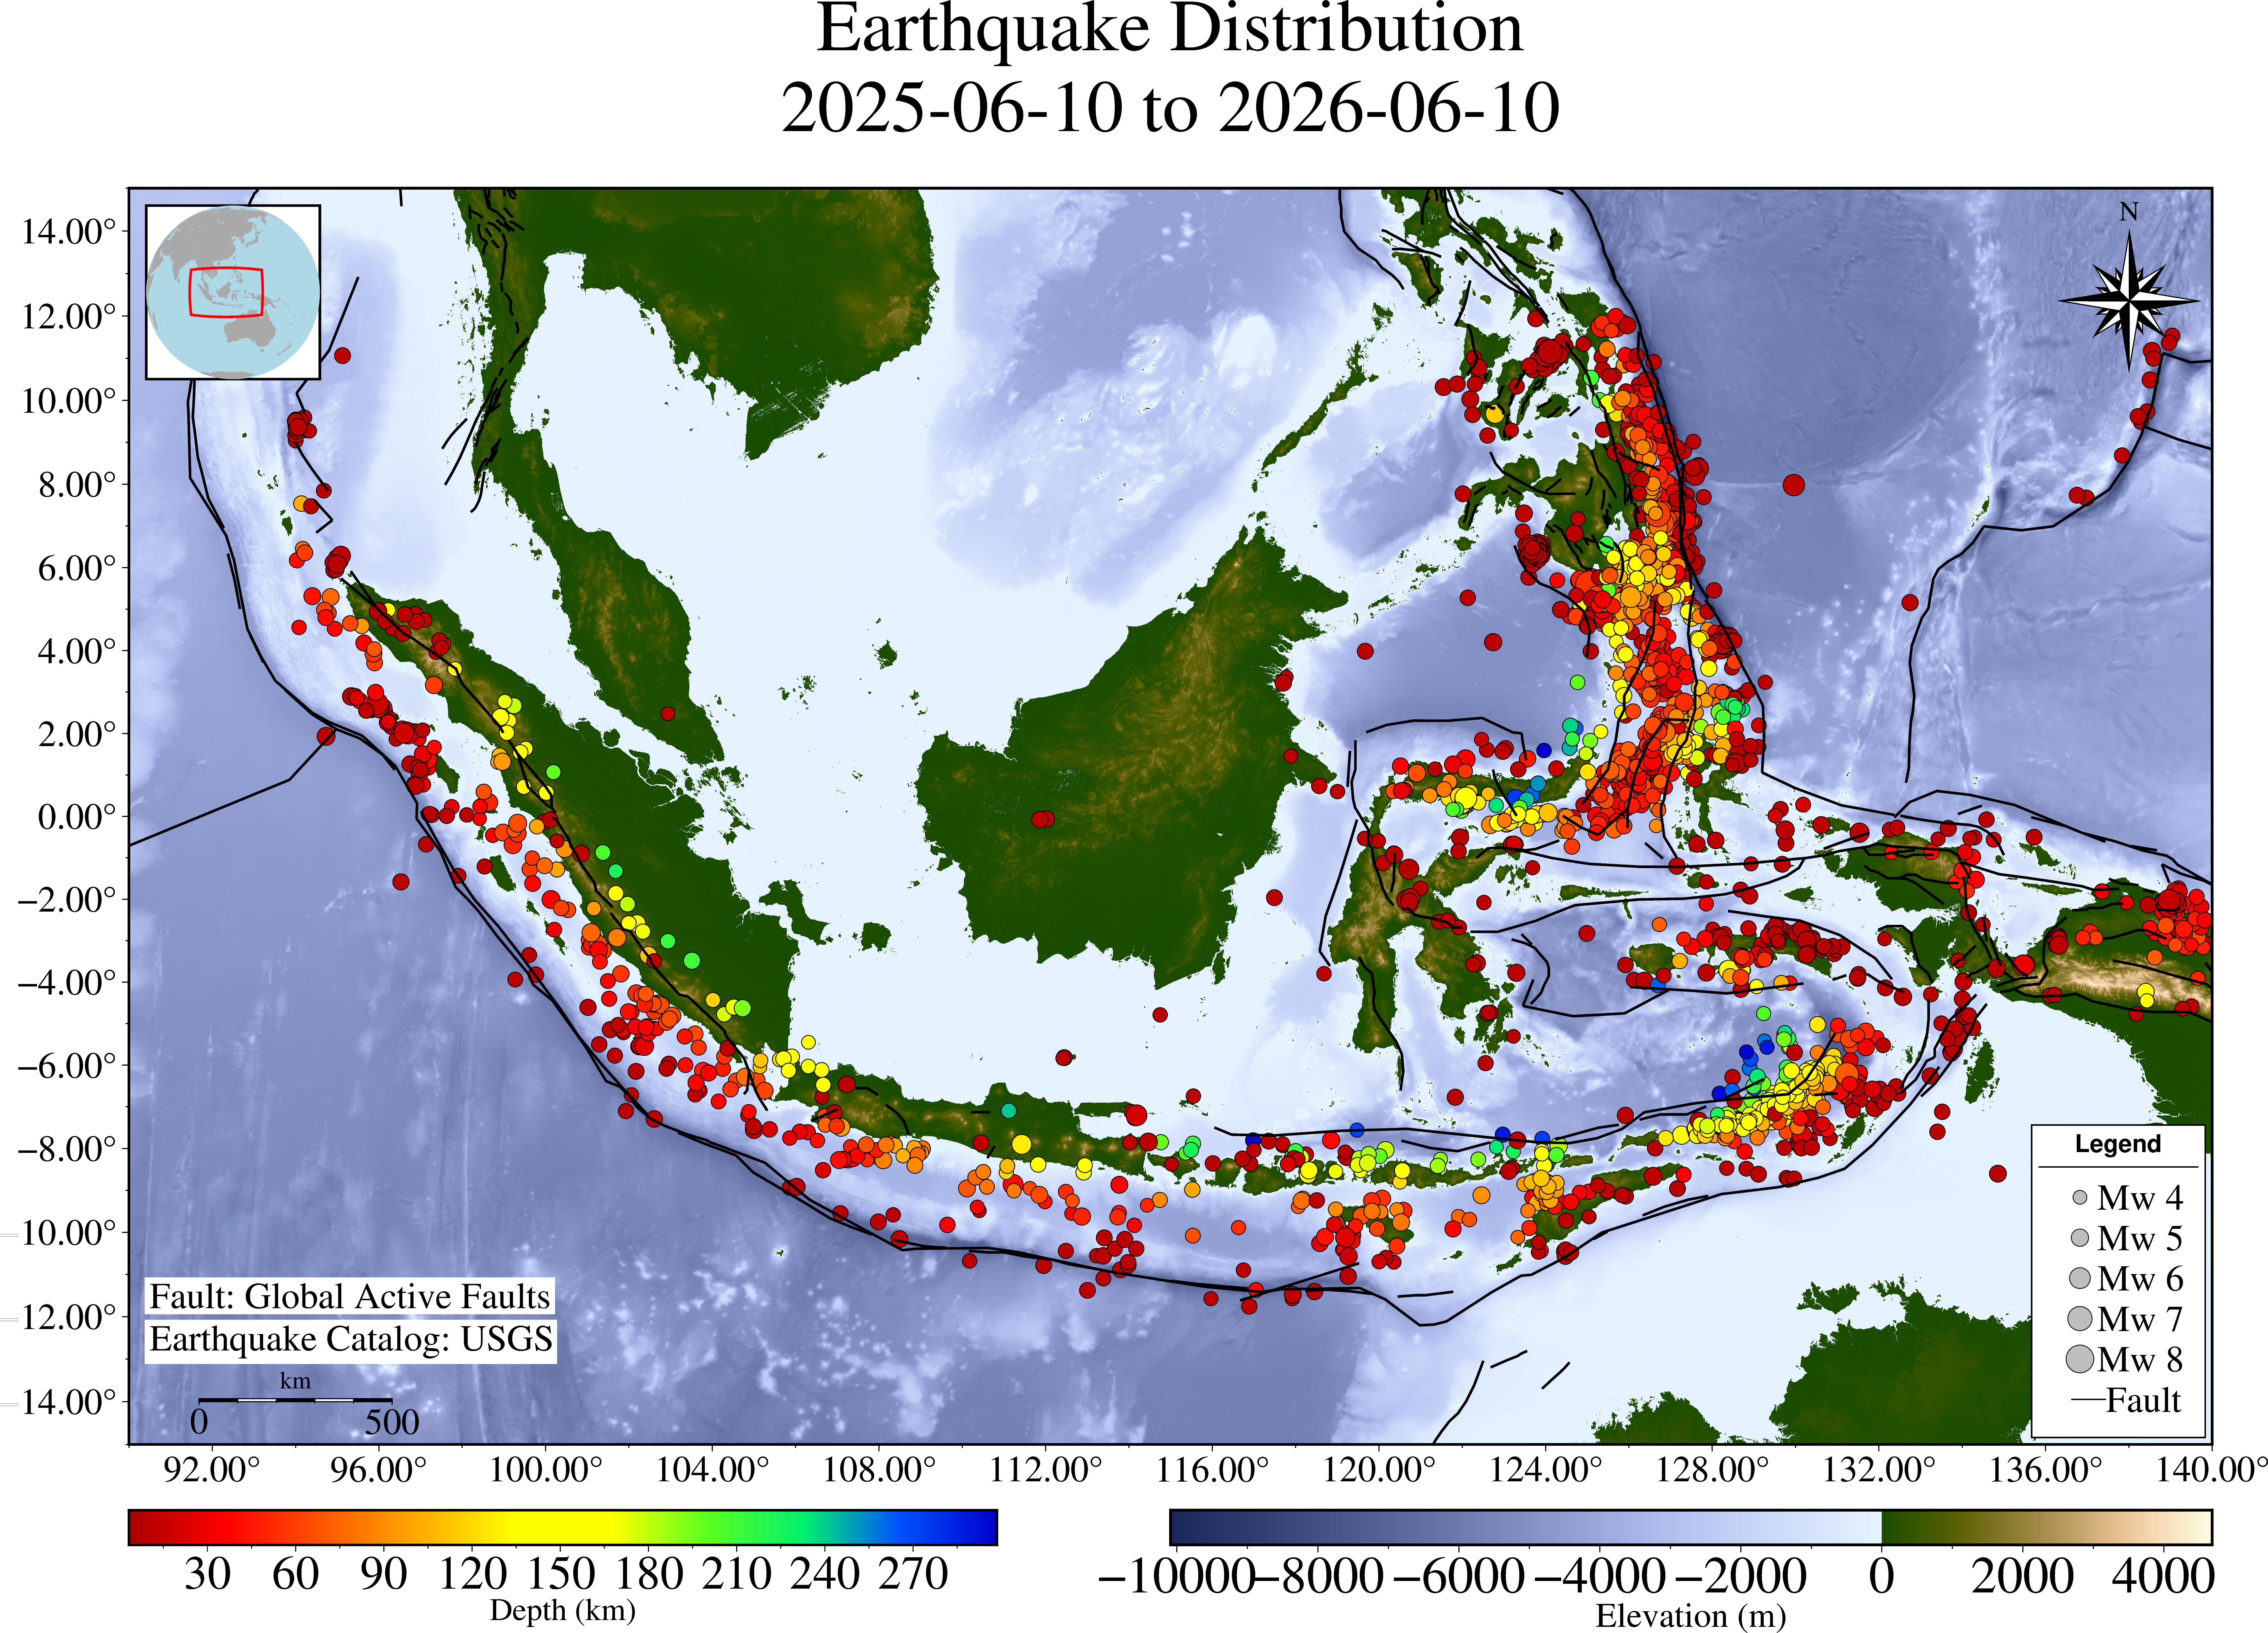
fig.basemap(frame=["ya2f1", "xa4f2", "+tEarthquake Distribution<break>2025-06-10 to 2026-06-10"],
rose="jTR+w4+f3+l,,,N",
map_scale=f"g{min_longitude_map+4}/{min_latitude_map+1}+w500k+f+l",
)
magnitudes = [x for x in range(min_magnitude, max_magnitude+1)] # Example magnitude values
legend_filename = "magnitude_legend.txt"
with open(legend_filename, "w") as f:
f.write("H 20p,Helvetica-Bold Legend\n")
f.write("D 0.2c 1p\n")
# Generate legend entry for each magnitude step
for m in magnitudes:
calculated_size = 0.1 * (m)
# Format: Code | Offset | Symbol | Size | Fill | Pen | Text-Offset | Label
f.write(f"S 1.25 c {calculated_size:.2f} gray 0.5p,black 1.75 Mw {m}\n")
with open(legend_filename, "a") as f:
f.write("S 1.5 - 1 black 1p 2 Fault\n")
fig.legend(spec=legend_filename, position="jBR+w5/9+o0.2c", box="+gwhite+p1p")
# ----------------------
# Inset Map Rectangle
# ----------------------
# with fig.inset(
# position="jTL+o0.5c",
# box="+gwhite+p2p",
# region=[94,141,-10,20],
# projection="M20/12"
# ):
# fig.coast(
# # water='lightblue',
# land='lightgrey',
# shorelines="1/0.5",
# # region=[94.5, 140, -10, 10],
# # projection="M30/30c"
# )
# rectangle = [[min_longitude_map, min_latitude_map, max_longitude_map, max_latitude_map]]
# fig.plot(data=rectangle, style="r+s", pen="2p,red")
# ----------------------
# Inset Map Globe
# ----------------------
with fig.inset(
position="jTL+o0.5c+w5c",
box="+gwhite+p2p",
):
fig.coast(region="g", projection="G120/0/5c", land="darkgray", water="lightblue")
rectangle = [[min_longitude_map, min_latitude_map, max_longitude_map, max_latitude_map]]
fig.plot(data=rectangle, projection="G120/0/5c", style="r+s", pen="2p,red")
output_file = "seismicity_indonesia_1yr"
# save the figure as PDF format (fmt=f), the parameter of +m1c is the margin page frame of 1 cm
fig.psconvert(prefix=output_file, fmt="f", resize="+m1c", dpi=300)
fig.show()
[ ]: